SERVICE
Service introduction


Getting out of Excel.
Simple and deep analysis tool
Characteristics of Alys
-
POINT01
Using Qlik View engine, we developed it as an analysis package for commercial facilities.※
-
POINT02
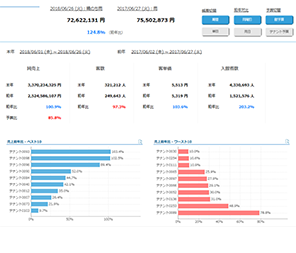
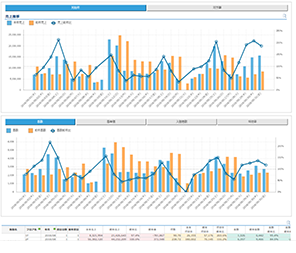
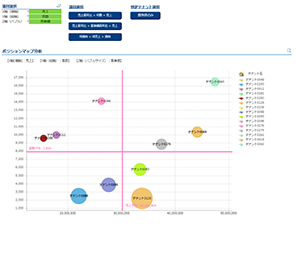
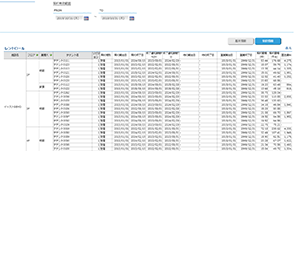
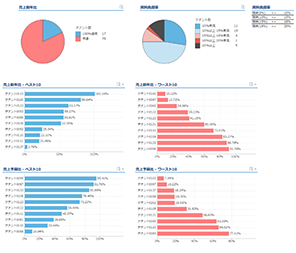
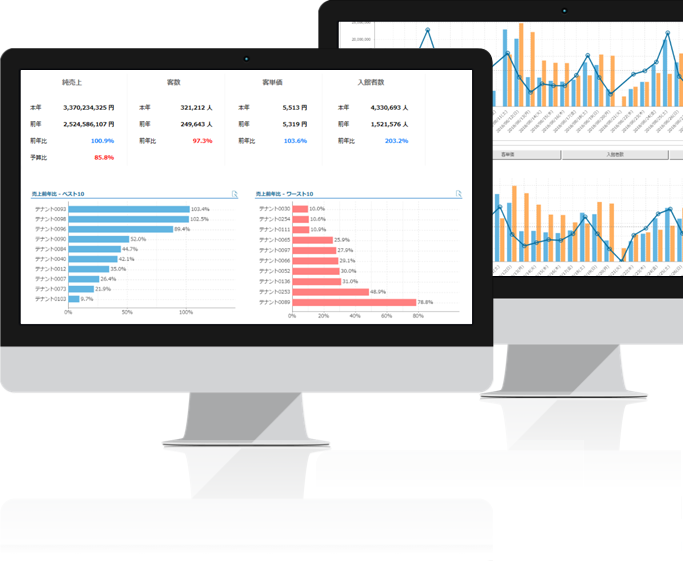
Data aggregation and analysis that allows you to visualize various data to be utilized easily, quickly and visually from a free perspective.
-
POINT03
By adopting a cloud-based system, low-cost system introduction and operation are realized.
-
POINT04
Significantly reduces the cost of customization after introducing the system.
-
POINT05
It is easy to collect data even if there are multiple systems.
※Qlik, QlikView and QlikTech are trademarks or registered trademarks of Qlik Technologies Inc. We offer QlikView products in partnership with Assist Co., Ltd.
Data aggregation and conceptual diagram
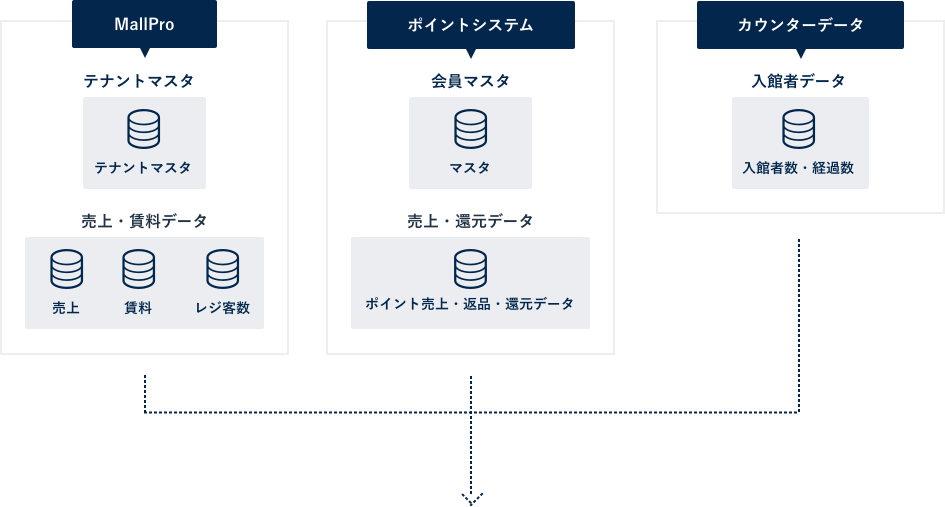
Connect from multiple systems to create an analysis for the operation of commercial facility.